Early YouTube Performance: Which First-Week Metrics Actually Predict Revenue

Early YouTube Performance: Which First-Week Metrics Actually Predict Revenue
A YouTube video's first 48 hours don't decide everything but they decide more than most teams realise.
The signals that compound into long-term revenue are visible early. Suggested impressions in the first 72 hours predict views you'll still be earning a year later. Audience geography in the first day predicts your revenue per thousand views for the entire lifetime of the video. Traffic source mix in the launch window tells you whether the audience will pay you well or pay you poorly.
The catch is that view counts alone tell you almost none of this. A 50,000-view first 48 hours can be a worse business outcome than a 15,000-view first 48 hours, depending on what those views are made of. This guide walks through which early metrics actually predict revenue, where the 48-hour rule holds and where it breaks, and what an effective early-window monitoring layer looks like for brands running channels at scale.
Why the first 48 hours matter (and what's actually being decided)
The 48-hour window is not arbitrary. It tracks how YouTube's recommendation system actually evaluates new uploads.
When you publish a video, the algorithm tests it within minutes against a small audience of likely viewers. That first batch comes from your subscriber base, viewers with related watch history, and a small allocation from browse and search surfaces. The signals the algorithm watches in that initial test are unambiguous: did people click, did they stay, did they engage? Strong signals trigger the next wave of distribution to a wider audience. Weak signals trigger reduced distribution and a much smaller next wave.
By the end of the first 24 to 72 hours, the algorithm has effectively classified the video into a distribution tier. Videos in higher tiers keep getting surfaced. Videos in lower tiers get progressively less reach. Moving up a tier later, after the initial classification has settled, is significantly harder than landing the classification correctly in the first place.
YouTube's own documentation on engagement signals confirms early metrics influence recommendations but stops short of naming a fixed cutoff. The 48-hour figure comes from the creator and analytics community rather than from a YouTube policy page. It's an operational heuristic, not a published rule. But it's consistent enough across creator analyses, vendor data, and broadcaster experience that operators treat it as the working assumption.
The practical implication: what happens in the first two days is more determining than what happens in the next two weeks. Monitoring early matters because the cost of intervening before classification is far lower than the cost of trying to revive a video that's already been sorted into a low tier.
Suggested impressions in the first 72 hours: the strongest single early signal
If you have to pick one metric to watch in the first three days, this is it.
A 2022 Creator's Toolbox study ran a multi-linear regression across 150 videos to identify which early signals statistically predict views from Day 4 through Day 365. The strongest single predictor by some distance was suggested impressions in the first 72 hours after upload. Click-through rate mattered. Initial views mattered. But suggested impressions in the first three days correlated more strongly with long-term performance than any other early metric in the model.
The mechanism is straightforward once you know what suggested impressions measure. These are the impressions where YouTube has chosen to surface your video alongside what someone is already watching. They sit on the right-hand sidebar on desktop, beneath the video on mobile, and on autoplay. Unlike browse impressions (which come from the homepage and are partly driven by your subscriber base) and unlike search impressions (which come from a query someone typed), suggested impressions reflect the algorithm's willingness to show the video to viewers who weren't actively looking for it.
That makes suggested impressions a vote of algorithmic confidence. The platform is signalling that it thinks this video can satisfy a stranger. When suggested impressions accumulate quickly in the first 72 hours, the algorithm is committing to expand the audience. When they stay flat, the algorithm has decided this video belongs with its existing audience and not beyond.
The honest qualification: the Creator's Toolbox finding has not been replicated at scale in published 2024-2026 research. It's a strong signal from a single sample, supported by practitioner consensus from analysts like Paddy Galloway and confirmed by broadcaster experience, but it's not a peer-reviewed cross-channel study. Treat it as the strongest available evidence rather than a settled scientific fact.
For operators, the practical use is simple. Check the Reach tab in YouTube Studio at the 24-hour and 72-hour mark. If suggested impressions are climbing, the algorithm is expanding the audience. If they're flat at 72 hours, the video has been sorted into a tier that limits reach, and packaging changes are the first lever to try.
The metrics that predict reach versus the metrics that predict revenue
This is the distinction most teams get wrong, and it's why view counts alone don't tell you what a video is actually worth.
Reach predictors and revenue predictors are different metrics measured at different layers. Reach predictors tell you how many people will see the video. Revenue predictors tell you how much each of those views will be worth.
The reach predictors in the first 48 hours are the metrics most operators already track: suggested impressions (the strongest signal as covered above), click-through rate, early watch time velocity, and early subscriber growth. Strong performance on these signals means the algorithm expands distribution and total views grow.
The revenue predictors are different. The first is audience geography. The same video earning 30,000 views with a 70% US and UK audience will generate substantially more revenue than the same video earning 30,000 views with a 70% audience from lower-RPM territories. RPM (revenue per thousand views) varies by country because advertiser demand and ad rates vary by country. Early geography is one of the few first-day signals that genuinely predicts where revenue will land.
The second is traffic source mix. Search-driven views often monetise better than browse-driven views because search intent indicates a viewer looking for something specific, which advertisers value more highly. External traffic from outside YouTube can carry premium ad value depending on the source. A video pulling early views heavily from search and external sources will typically generate higher RPM than the same video pulling early views from suggested and browse.
The third is the watch-page versus Shorts split. Long-form watch-page content runs standard pre-roll, mid-roll, and display ads. Shorts revenue comes from a different pool with different mechanics and generally lower revenue per view. A video earning 50,000 views split 80% Shorts and 20% watch-page will earn a fraction of what 50,000 watch-page-only views would generate.
The fourth is returning versus new viewer mix. Returning viewers signal a loyal audience, which advertisers value more highly because the channel has demonstrated repeat engagement. Strong returning viewer share in the first 48 hours predicts both higher RPM and longer session times across the channel.
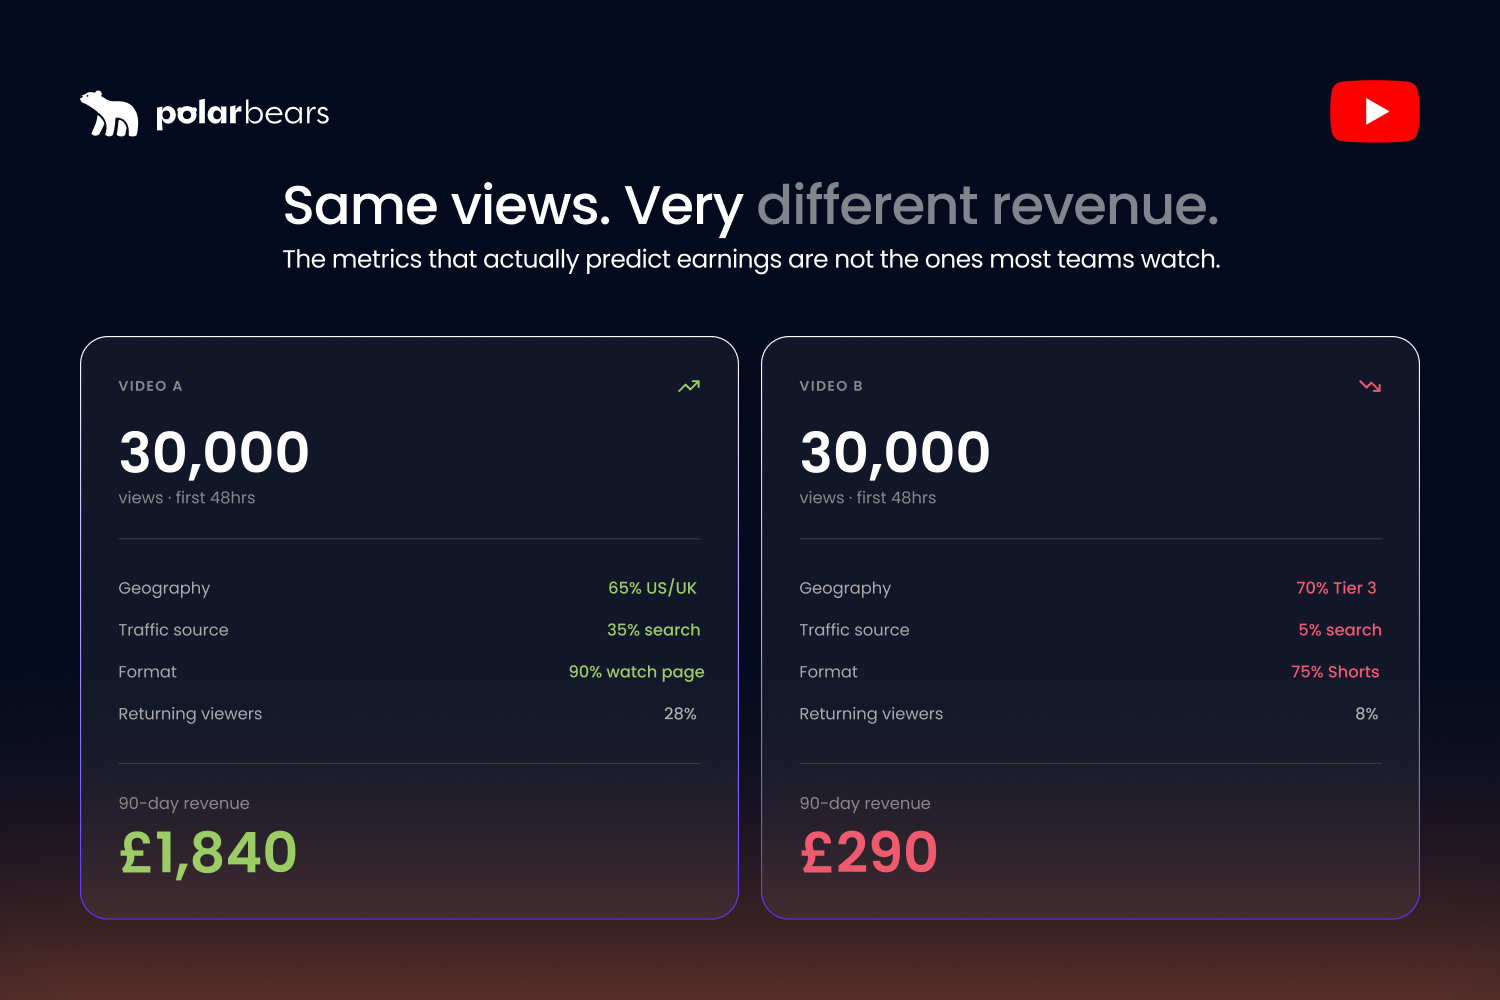
Combining these reveals what reach numbers obscure. Two videos with identical 30,000-view first-48-hours performance can have wildly different revenue trajectories depending on whether the audience came from high-RPM countries on watch-page with strong returning viewer share, or low-RPM countries on Shorts with weak returning share. The first will compound into meaningful revenue. The second will not.
For a deeper look at how each of these signals interacts with your overall analytics setup, our guide to the YouTube metrics that actually matter in 2026 walks through the full set of signals worth watching across your channel.
When the 48-hour rule holds and when it breaks
The 48-hour rule is content-type specific. Applying it uniformly across an entire content portfolio is where most monitoring programmes go wrong.
For browse-led entertainment, the rule holds strongly. A Premier League highlights video on a sports channel, an entertainment clip on a kids and family channel, a celebrity gossip explainer on a news channel — all of these depend on algorithmic distribution to homepage and suggested surfaces. If they don't get traction in 48 hours, they typically don't get it later. The algorithm has classified them, and that classification rarely improves through patience alone.
For search-led tutorials, the rule breaks. A "how to bake sourdough" video on a cooking channel can build steady search traffic over weeks and months, even with a quiet first 48 hours. Search results are less time-sensitive than recommendation surfaces. A video that ranks well for a query keeps earning impressions as long as people keep searching, regardless of when the original upload happened. The right monitoring window for search-led content is 7 to 30 days, not 48 hours.
For evergreen educational long-form, the window is longer still. A 25-minute deep-dive on a financial concept, or a technical walkthrough on an enterprise software topic, can compound for months as it gets added to playlists, embedded in articles, and surfaces in semantically related search queries. Some of the strongest-performing evergreen content has quiet first weeks and meaningful second and third quarters. Monitoring at 60 to 90 days makes sense for this category. Judging at 48 hours does not.
For Shorts, the dynamics are different again. Shorts often get tested in immediate bursts within the first few hours of upload and can either settle into the Shorts feed for a longer tail or surge and then plateau. The metrics that matter for Shorts (stayed-to-watch, replay rate, swipe-away rate) are different from the metrics that matter for long-form, and so is the monitoring rhythm. The 48-hour rule for Shorts is more like a 4 to 24-hour rule with longer-tail re-surfacing possible later.
For news and topical content, the window is shorter. A breaking news video might peak inside 6 hours and decay quickly. Topical content on a sports event or pop culture moment usually completes its main run in 48 hours and then declines, even if the underlying topic stays relevant for weeks.
The implication for multi-channel ops is that the monitoring system needs to apply different windows to different content types, not one rule across the network. A broadcaster running entertainment, sports, kids, news, and evergreen tutorials needs five different early-performance frameworks, not one. Treating them all the same fires the wrong alerts on the wrong content.
The revenue-quality signals most teams ignore
Even teams that understand the difference between reach and revenue often miss the early signals that genuinely predict business outcomes.
Audience geography in the first 24 hours is the most underused predictor. Most operators look at total country distribution at the 30-day mark when the data has stabilised, but the first-day skew often holds. If the first 24 hours show 80% Tier-3 country audience, that mix tends to persist across the lifetime of the video. The reason is algorithmic: the audience the platform finds in the first day is the audience it keeps surfacing the video to, with some drift over time. Strong early audience-quality signals compound. Weak ones compound too.
Traffic source mix in the first 48 hours is the second underused predictor. The default assumption is that browse and suggested traffic is the gold standard because it represents algorithmic confidence. For pure reach, that's true. For revenue, it's often the opposite. Search traffic tends to monetise better because it carries intent. External traffic from referral sources can carry premium ad value. A video showing 60% suggested traffic and 10% search in the first 48 hours will likely earn less per view than a comparable video showing 40% suggested and 30% search.
The watch-page versus Shorts split in the first day signals revenue trajectory clearly. If a long-form upload is being primarily surfaced through Shorts-adjacent feed positions, the revenue profile will skew toward the Shorts pool. If a Shorts upload is somehow pulling watch-page-style suggested impressions, the revenue per impression will be unusually high. Watching the format split early gives an honest read on what the revenue will look like before it materialises.
The returning viewer share in the first 48 hours is the most subtle of the four. Returning viewers signal channel health and audience loyalty, both of which matter to advertisers buying brand-safe inventory. A channel where 35% of first-48-hour viewers are returning is in a structurally different position from a channel where 8% are returning, even if the absolute view counts look similar. The returning share predicts the channel's ability to monetise consistently, not just the individual video's revenue.
Worked example to make the numbers concrete. Two sports highlights videos, both pulling 30,000 views in the first 48 hours. Video A: 65% US/UK/Canada audience, 35% search and external traffic, 90% watch-page, 28% returning viewers. Video B: 70% Tier-3 country audience, 5% search, 75% Shorts, 8% returning viewers. Video A will likely generate 4 to 8 times the revenue of Video B over the next 90 days. The view counts don't show that. The quality signals do.
What YouTube Studio actually shows you in the first 48 hours
Studio is genuinely good at single-channel early-window monitoring once you know where to look. The gap is at portfolio scale, not per channel.
The Realtime card shows you the first 48 hours in detail. Views, watch time, top traffic sources, top videos. It updates close to live. For a single channel and a single upload, this is the fastest read on what's happening.
The First 24 Hours filter inside Advanced Mode lets you compare a new video against any other video from the channel at the same point in its lifecycle. This is the underused feature most channel managers don't use enough. Comparing the new video against the channel's last five same-format uploads tells you whether the early signal is normal, strong, or weak relative to your own baseline, which matters far more than industry benchmarks.
The Reach tab shows impressions, suggested impressions, browse impressions, and search impressions broken down separately. This is where you check the Creator's Toolbox finding — looking specifically at suggested impressions at 24 and 72 hours.
The Audience tab shows geography and returning versus new viewer mix from the first day onward. This is where the revenue-quality signals live, and most operators don't open this tab until much later in the video's lifecycle.
The Traffic Sources report shows the browse, suggested, search, external, and notification split. Combined with the Reach tab, this is where you read the early revenue trajectory.
What Studio doesn't do at scale: it shows you all of this for one channel at a time. There's no native rollup across the network. There's no scheduled alert when a video's early signals deviate from the channel's expected pattern. There's no portfolio view that lets a head of digital see which of last week's 47 uploads across 25 channels are tracking strong and which are tracking weak in the first 48 hours. That gap is what operators end up filling with their own tooling or with an agency layer.
When a slow start isn't a death sentence
The honest counter to "if it flops in 48 hours, it's dead" is that some flops genuinely recover. Knowing which ones is the discipline.
Search-led content recovers regularly. A video targeting a specific query can sit quietly for weeks and then start accumulating views as the search ranking improves. If the topic has real ongoing demand and the video is structured for search (clear title, strong description with the target keyword, accurate chapters), patience often pays off.
External promotion recovery happens when a video gets picked up by a source outside YouTube weeks or months after upload. A LinkedIn post, a Reddit thread, a press mention, an inclusion in someone else's newsletter — any of these can drive a fresh wave of traffic that triggers a second algorithmic test. If the second wave generates strong engagement, the algorithm may reclassify the video into a higher tier.
Re-optimisation recovery happens when an operator changes the title, thumbnail, or both, and the new package lifts CTR enough to reset the algorithmic test. This works best when the underlying content is strong but the original package failed to communicate the value. It works worst when the content itself doesn't deliver and the new package just sets a higher bar that the video fails to meet.
Topical-relevance recovery is the wild card. A video on a niche subject can suddenly accumulate views months later because a related event brings the topic back into conversation. A retrospective video, an explainer on a person who suddenly returns to the news, an analysis of an industry that suddenly becomes relevant. None of this is plannable, but it does happen, especially for evergreen content on durable subjects.
What this means operationally: even with a strict 48-hour decision window for browse-led content, the right approach is not "delete or republish" but "set a longer review point and accept the result then." Browse-led content: 7 days for the final read. Search-led: 30 days. Evergreen: 90 days. After those windows, the result is the result. Effort goes to the next upload, not into trying to revive a video the audience didn't want.
Building the early-window monitoring layer
Three things matter when you're setting up or replacing the system that watches the first 48 hours across your channels.
The first is scheduled checks at the right intervals for each content type. A single 48-hour check across all content misses the search-led recovery curve and over-reacts to slow-burn evergreen. The system needs to apply browse-led timing to browse-led content, search-led timing to search-led content, and so on. That requires the system to know which content category each upload belongs to, which means either tagging at upload or training the system to infer category from metadata.
The second is per-channel and per-segment thresholds. Strong early-window performance on a sports highlights channel looks different from strong early-window performance on a kids and family channel. A 4% CTR is excellent on one and weak on another. A 65% returning viewer share is normal on an evergreen tutorial channel and unusually high on a news channel. The thresholds that trigger alerts need to be calibrated per channel and per content segment, not applied uniformly.
The third is automated alerts when launch-window performance breaks the channel's pattern. The alerts need to go to the people who can act on them: channel managers for packaging changes, content leads for category-level patterns, finance for portfolio-level revenue signals. The alerts also need to be quiet enough that they don't get ignored. A system that fires 50 alerts a day teaches the team to ignore alerts. A system that fires three high-confidence alerts a week gets read.
At The Polar Bears, the monitoring layer in our stack is Powered by Vixxi, the platform we license to consolidate YouTube, Google Ads, and Google Ad Manager into one workflow. For the broadcaster and publisher clients we work with, it handles per-channel timing, per-segment thresholds, and the scheduled alerting that Studio doesn't natively provide. The specific tool matters less than the principle. What matters is that the early signals get watched at the right intervals, by the right people, against the right baselines.
FAQ
How important are the first 24 hours on YouTube?
Very important for browse-led content, less important for search-led and evergreen content. In the first 24 hours, the algorithm tests a new upload against a small audience and decides whether to expand distribution. Strong early signals (CTR, watch time, suggested impressions) trigger wider distribution. Weak signals reduce future reach significantly. For browse-led entertainment, news, and trending content, the first 24 hours often shape what the video will do for its lifetime. For search-led tutorials and evergreen educational content, the first 24 hours matter much less because those videos build via search ranking over weeks and months.
What is a good number of views in the first 24 hours?
There is no universal benchmark. A 5,000-view first 24 hours can be excellent for a niche B2B channel and weak for a sports highlights channel built to do six figures per upload. The number that matters is your own channel's recent median for the same content format. Compare every new upload against the last five to ten same-format videos from your own channel at the same point in their lifecycle. The First 24 Hours filter in YouTube Studio's Advanced Mode makes this comparison directly. Industry benchmarks without channel context are usually misleading.
Can a YouTube video recover after a slow start?
Yes, in specific circumstances. Search-led content frequently recovers as search ranking improves over weeks. External promotion (a viral social media post, a press mention, an inclusion in a newsletter) can trigger a fresh algorithmic test that reclassifies the video. Re-optimisation through a stronger title or thumbnail can lift CTR enough to reset distribution. Topical relevance can bring a video back months later if related events make the topic resurface. Browse-led content rarely recovers without one of these specific triggers. Search-led and evergreen content recover regularly through patience alone.
How many views are considered viral on YouTube?
There is no fixed threshold, but the practical benchmark most analysts use is a video performing at least 5 to 10 times its channel's typical view count within its first few days. A 20,000-view video can be viral for a 1,000-subscriber channel and an underperformer for a multi-million-subscriber channel. Industry-wide, viral videos tend to share three traits: high CTR (typically above 8%), strong returning viewer share, and rapid expansion into browse and suggested surfaces beyond the channel's normal audience. Absolute view counts are less useful for measuring virality than the gap between actual and expected performance.
Do suggested impressions predict long-term YouTube success?
The strongest single statistical signal from public research is that suggested impressions in the first 72 hours correlate strongly with views from Day 4 to Day 365. The finding comes from a 2022 Creator's Toolbox multi-linear regression across 150 videos. It has not been replicated at scale in published 2024-2026 research, but practitioner consensus and broadcaster experience support the pattern. Suggested impressions reflect the algorithm's confidence in showing the video to viewers who aren't actively searching for it. High suggested impressions in the first 72 hours typically signal the algorithm will continue expanding distribution. Flat suggested impressions usually mean the video has been sorted into a limited distribution tier.
What metrics matter most in the first 48 hours of a YouTube video?
For reach prediction: suggested impressions, click-through rate, and early watch time velocity. For revenue prediction: audience geography, traffic source mix, watch-page versus Shorts split, and returning versus new viewer share. View counts alone are weak predictors because they obscure the difference between high-quality revenue-generating views and low-quality views that won't compound. The combination that genuinely predicts long-term revenue is strong suggested impressions paired with high-RPM audience geography, healthy search and external traffic share, and a meaningful returning viewer base.
Want early-window monitoring that catches revenue signals before they fade?
If you liked that why not take a look

Copyright Claims vs Strikes: What Brands and Broadcasters Need to Know
Copyright claims and strikes are not the same thing. What each does to your channel, when to dispute, and how brands manage copyright risk at scale.
YouTube Content ID Explained: How Rights Holders Protect and Monetise Their IP
What YouTube Content ID is, who gets access, and how rights holders use it to protect and monetise content. Payouts, policies and pitfalls explained.
What Security and Compliance Should a YouTube Agency Have?
Your agency holds your accounts and data. What SOC 2, ISO 27001, GDPR and Cyber Essentials actually mean, and what to ask before you sign.
Should Your YouTube Agency Work With Your Competitors?
Your agency might run your rival's channel too. Why agency conflict of interest matters, how good agencies keep competing clients apart, and what to ask.
What Should a YouTube Agency Put in Writing?
Most YouTube agencies dodge written commitments. What a good agency should promise: response times, reporting cadence, and fixing underperforming videos.
What Data Can You Take When You Leave a YouTube Agency?
Can you take your analytics, dashboards and custom reports when you leave a YouTube agency? What data is yours, what is not, and how to avoid lock-in.

Ready to maximise your YouTube revenue?
Get in touch and let’s begin exploring your channel’s hidden potential.